Methodology
Stanford Design Thinking
-
This method was chosen in order to discover user needs and pain points as well as validate business ideas before beginning to build the product.
-
Iteration occurred in various areas of the project where further work was needed including the Empathise stage, Define stage, and the Prototyping stage

Empathise
Primary and Secondary Resarch
PROCESS
-
In this stage, a literature review, interviews with pet owners and experts and a user survey were conducted
-
Recruitmentment through social media: Facebook and Reddit and word of mouth
DISSEMINATION
-
Most users identified reminders, sending pet details to vets and finding pet services near them as the most useful features
-
Most users stated they had trouble remembering to schedule vaccines, take care of their pet's grooming and hygiene and finding important pet documents
USER INTERVIEWS
-
As opposed to the survey, user interviews are designed to target a smaller (but still representative) population in order to be able to delve into understanding the user’s day-to-day in caring for their pets, pain points they may have and solutions they believe they need. User interviews provide much more flexibility to users when answering questions provided by the researcher as they do not have to conform to multiple choice answers, don’t have the added strain of user input like surveys but also can add extra information which may not directly relate to the question but is still useful to understand their overall experience as pet owners. Due to the spoken, narrative nature of user interviews the interview results are disseminated using qualitative methods.


USER SURVEY
-
After completing the secondary research which served as the foundation for this project, a user survey was completed targeting pet owners in the United Kingdom to further understand the experience of pet owners. The survey’s aim was to receive a high volume of responses from pet owners in a quick manner with regards to their demographics, their needs and their current pain points in caring for their pets.


-
An affinity diagram was first completed which broke down each the interview transcripts into themes eight themes – routines and activities, enjoyment from pet ownership, challenges in pet care, health tracking and record keeping, technology in pet care, desired features, importance of reminders and family sharing.

-
Following the creation of the affinity map, an information cluster diagram was created to better visualise common issues and trends in four main themes. These are user pains, user delights, sentiment towards features and reminders.
Define
Defining the User Experience
-
In this process, a series of methods were carried out: empathy mapping, user personas, journey mapping, POV statements, user stories and service blueprint.
-
It’s necessary to define the average user experience in caring for their pets so that there are concrete goals and problems to ideate for
-
Below are the three personas created based on the target users, and their related scenarios.


Ideate
Ideating Solutions to User Needs
-
To begin the ideation phase, an ideation workshop was conducted with the target demographic of users. Users were asked to complete Crazy 8's and then evaluate each other's designs using the NUF test, where the best designs were chosen.

-
After completing the workshop I continued the ideate stage by answering the HMW questions myself and doing my own crazy 8's to ideate extra solutions.

-
The last methods completed in the ideate stage were: a feature list, site map and user flow.


-
Following the define stage, the user insights discovered were utilised to create design challenges for which to ideate for (Rosala, 2021b). This was done by constructing four How Might We Questions which encompassed the challenges faced by users.
Prototype
Designing the App
-
The first step in the prototyping stage was to create a lo-fi design of the app, to test the features in practice and ensure the best user experience in a quick way before moving on to designing digitally.
-
The design was tested twice at the lo-fi stage to ensure that the app’s features and layout met user’s needs before moving on to designing the mid-fi in more depth.


-
A new sitemap was created to include all the changes derived from user feedback and the depth added by the mid-fi

-
A wireflow was also created to to allow the visualisation of possible user actions throughout the app and identify usability issues

Usability Test
Summative
-
Once at the hi-fi stage, a summative usability test and a SUS questionnaire was conducted with three users recruited through word of mouth.
-
This was a key stage in the project as it allowed to access the user experience for the final prototype and uncovered improvement opportunities for the future (Moran, 2019).
-
The findings were disseminated qualitatively, using card sorting and information clustering.

-
Due to the qualitative nature of the usability test carried out in the previous section, it did not measure user experience but identified what the users enjoyed and discovered any problems within the prototype (Moran, 2019). Therefore, in order to quantitatively calculate the perceived usability of the prototype a SUS questionnaire was conducted after the usability test. The users answered ten questions by ranking them on a scale of 1-5, where 1 represents strongly disagree and 5 represents for strongly agree (Bellio, 2023).
-
The SUS score achieved was an A, with 95 points, passing the prototype with overwhelmingly positive feedback and minor adjustments

Final Product
PetBuddy
Dashboard
-
Intuitive dashboard with all necessary tools for users to succeed in taking care of their pets
-
Various users can be attributed to tasks to better organise pet care within households
-
Budget tracker aids users struggling with the financial aspect of pet care and the streak tracker incentivises users to return to the app everyday


Services
-
Users are able to get into contact with vets quicker than ever before
-
Vets experience faster processing of clients through a standard triage before an appointment is booked


Resources
-
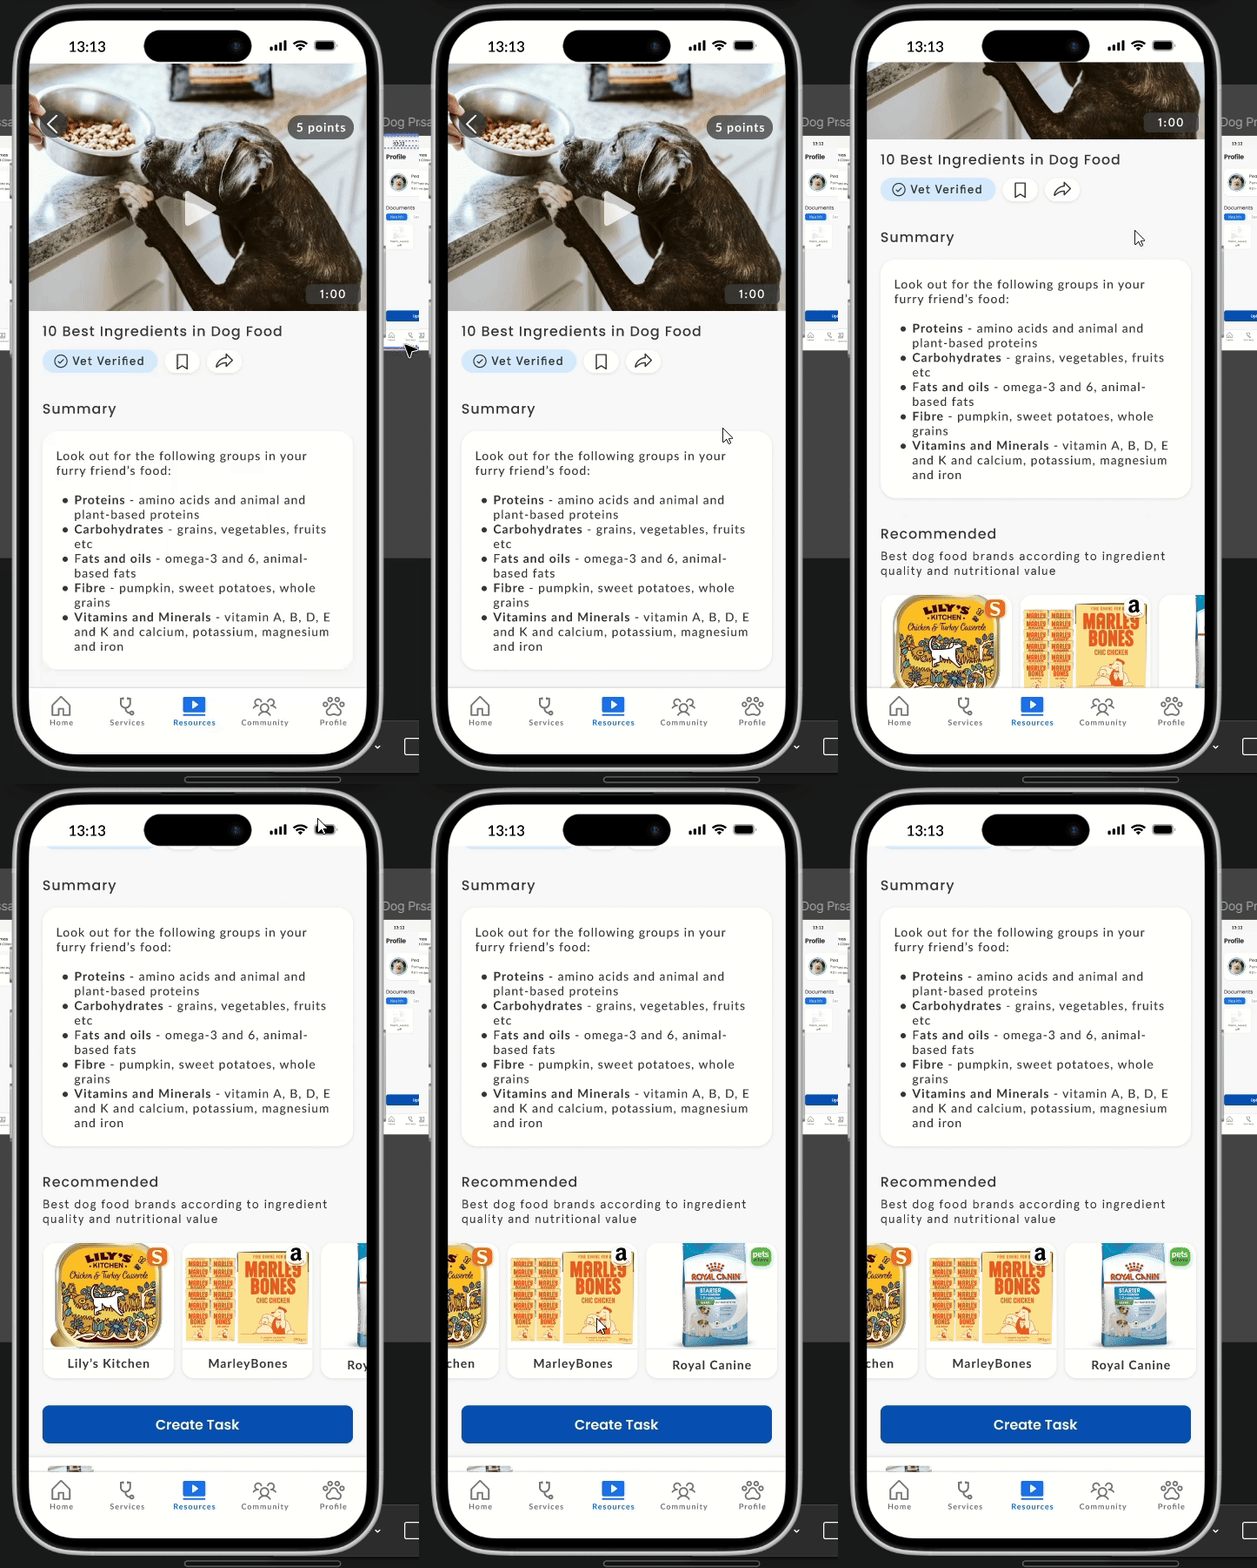
Users can educate themselves with out vet verified videos on a variety of topics
-
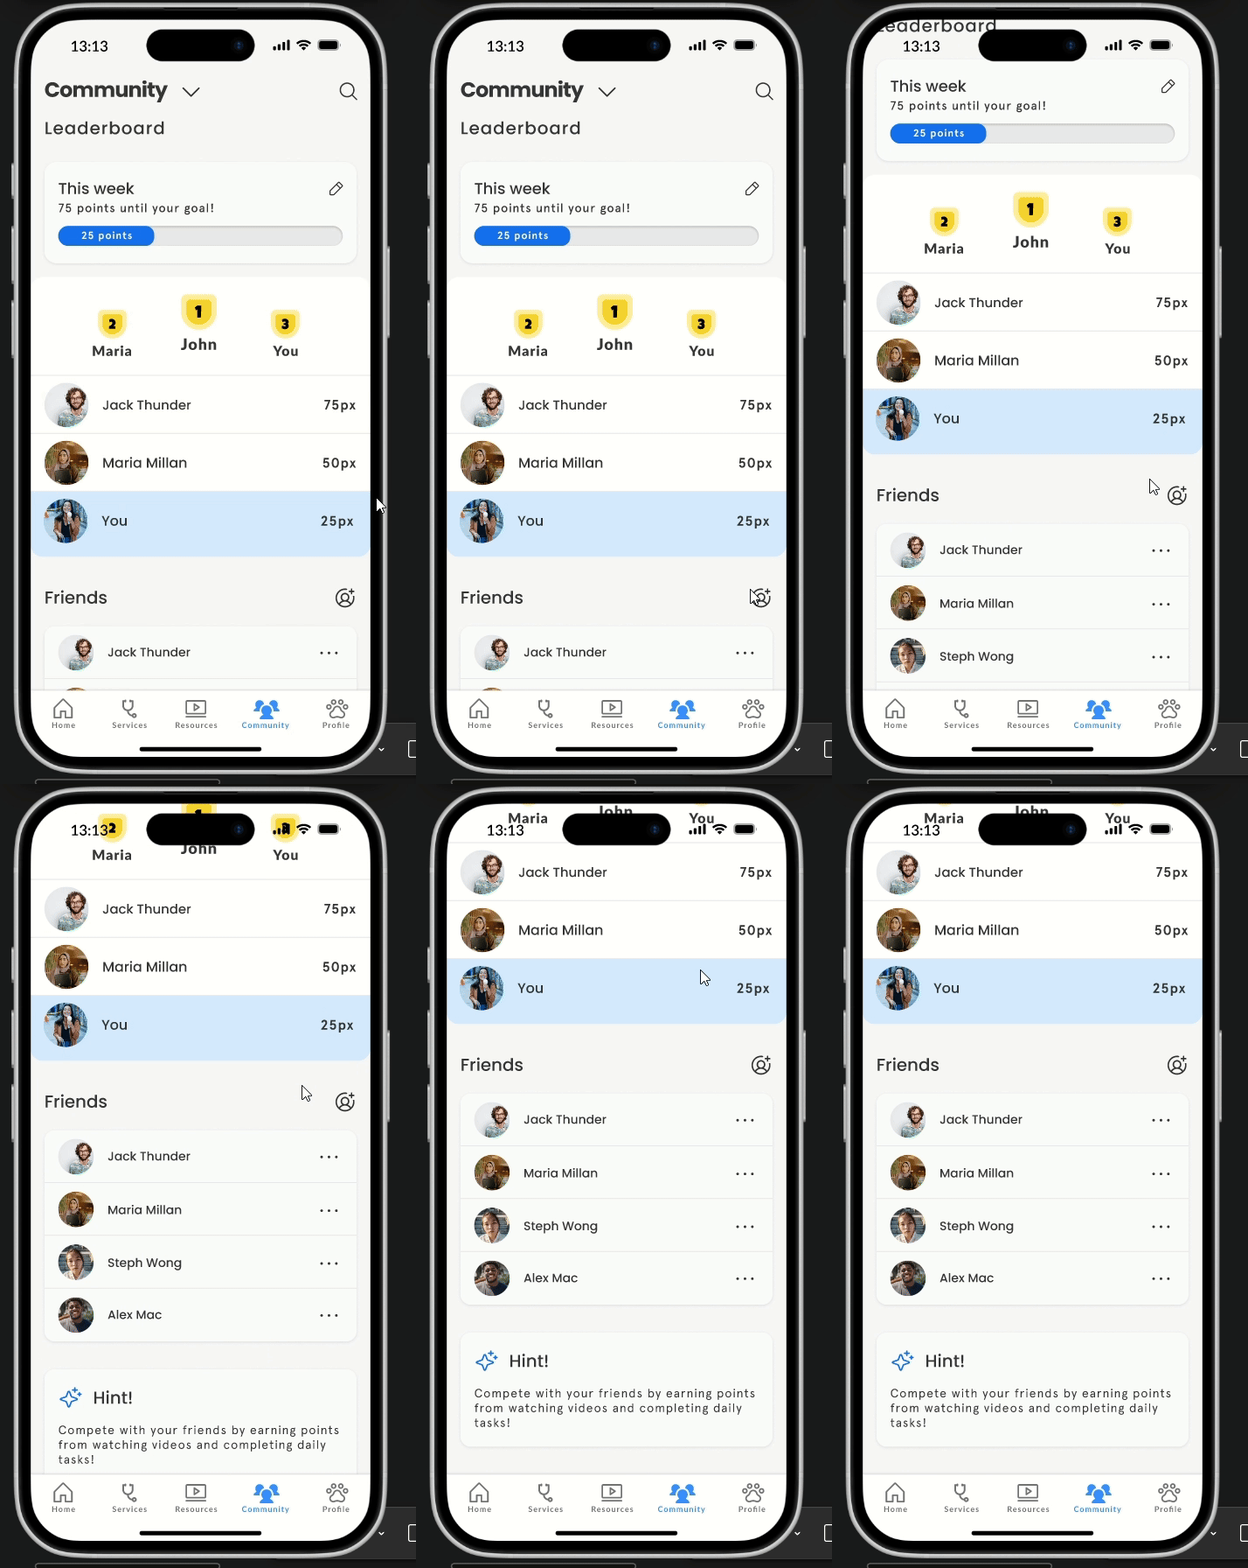
Points are attributed to every video to motivate users. Users point total can be seen in the the community page leaderboard


Community
-
Community section allows users to connect with likeminded pet owners, share resources and experiences
-
The leader board showcases points earned from watching videos and allows for friendly competition between friends


Profile
-
Users can store and manage their pets information and documents easily through the app
-
Multiple users can be part of the family, including pet sitters, to facilitate the management of pet care

